Lab 4: Monitoring Applications and Infrastructure
© 2026 Amazon Web Services, Inc. or its affiliates. All rights reserved. This work may not be reproduced or redistributed, in whole or in part, without prior written permission from Amazon Web Services, Inc. Commercial copying, lending, or selling is prohibited. All trademarks are the property of their owners.
Note: Do not include any personal, identifying, or confidential information into the lab environment. Information entered may be visible to others.
Corrections, feedback, or other questions? Contact us at AWS Training and Certification.
Lab overview
As the CloudOps engineer for your company, you are asked to create a monitoring solution for one of the company’s more heavily used application servers. The monitoring needs to achieve situational awareness to provide timely and effective responses. To achieve this task you: configure the telemetry agent on your Amazon EC2 instances, create a CloudWatch dashboard to display and view only the metrics you want, configure an automated notification system for events that go past a defined alarm threshold, and you manually test the created alarms using the AWS CLI.
You practice setting up and monitoring metrics for business application events, defining relevant event thresholds for metrics, creating an automated notification, and remediation when metric thresholds are exceeded. Tasks include making use of a locally installed Amazon CloudWatch agent for collecting and monitoring telemetry from Amazon Elastic Compute Cloud (Amazon EC2) instances. The published metrics are used with customized dashboards, alarming, and notification services.
Monitoring of applications and infrastructure is much more than tracking latency and CPU usage of your systems. Relevant metric creation, log collection, event monitoring and alerting, and remediation are all integrated parts of a mature and robust monitoring system. Monitoring provides tools for making informed business decisions on capacity planning, costs, utilization, and security.
Objectives
By the end of this lab, you should be able to do the following:
- Configure telemetry on Amazon Elastic Compute Cloud (Amazon EC2) instances using the Amazon CloudWatch agent, AWS Sessions Manager, command documents, and Parameter Store.
- Create a CloudWatch dashboard to display CloudWatch agent metrics.
- Subscribe to Amazon Simple Notification Service (Amazon SNS) topics for automatic notifications.
- Configure CloudWatch alarms for monitoring and notification when specific metric thresholds are crossed.
- Manually test any CloudWatch alarm in your AWS environment using the AWS Command Line Interface (AWS CLI).
- Create an AWS Lambda based Canary alarm for a web server.
Technical knowledge prerequisites
This lab requires the following prerequisites:
- Access to a computer with internet and Microsoft Windows, macOS X, or Linux.
- An internet browser, such as Google Chrome, Mozilla Firefox, or Microsoft Internet Explorer 11 (previous versions of Internet Explorer are not supported).
- Basic knowledge of AWS Systems Manager, Amazon CloudWatch, Amazon SNS, and AWS Lambda.
Icon key
Various icons are used throughout this lab to call attention to different types of instructions and notes. The following list explains the purpose for each icon:
- Caution: Information of special interest or importance (not so important to cause problems with the equipment or data if you miss it, but it could result in the need to repeat certain steps).
- Command: A command that you must run.
- Copy edit: A time when copying a command, script, or other text to a text editor (to edit specific variables within it) might be easier than editing directly in the command line or terminal.
- Expected output: A sample output that you can use to verify the output of a command or edited file.
- File contents: A code block that displays the contents of a script or file you need to run that has been pre-created for you.
- Hint: A hint to a question or challenge.
- Learn more: Where to find more information.
- Knowledge check: An opportunity to check your knowledge and test what you have learned.
- Note: A hint, tip, or important guidance.
- Task complete: A conclusion or summary point in the lab.
- Warning: An action that is irreversible and could potentially impact the failure of a command or process (including warnings about configurations that cannot be changed after they are made).
Start lab
-
To launch the lab, at the top of the page, choose Start Lab.
Caution: You must wait for the provisioned AWS services to be ready before you can continue.
-
To open the lab, choose Open Console .
You are automatically signed in to the AWS Management Console in a new web browser tab.
Warning: Do not change the Region unless instructed.
Common sign-in errors
Error: You must first sign out
If you see the message, You must first log out before logging into a different AWS account:
- Choose the click here link.
- Close your Amazon Web Services Sign In web browser tab and return to your initial lab page.
- Choose Open Console again.
Error: Choosing Start Lab has no effect
In some cases, certain pop-up or script blocker web browser extensions might prevent the Start Lab button from working as intended. If you experience an issue starting the lab:
- Add the lab domain name to your pop-up or script blocker’s allow list or turn it off.
- Refresh the page and try again.
Lab environment
The following diagram represents the major components used in this lab. The numbers represent the logical workflow of the architecture in this lab.
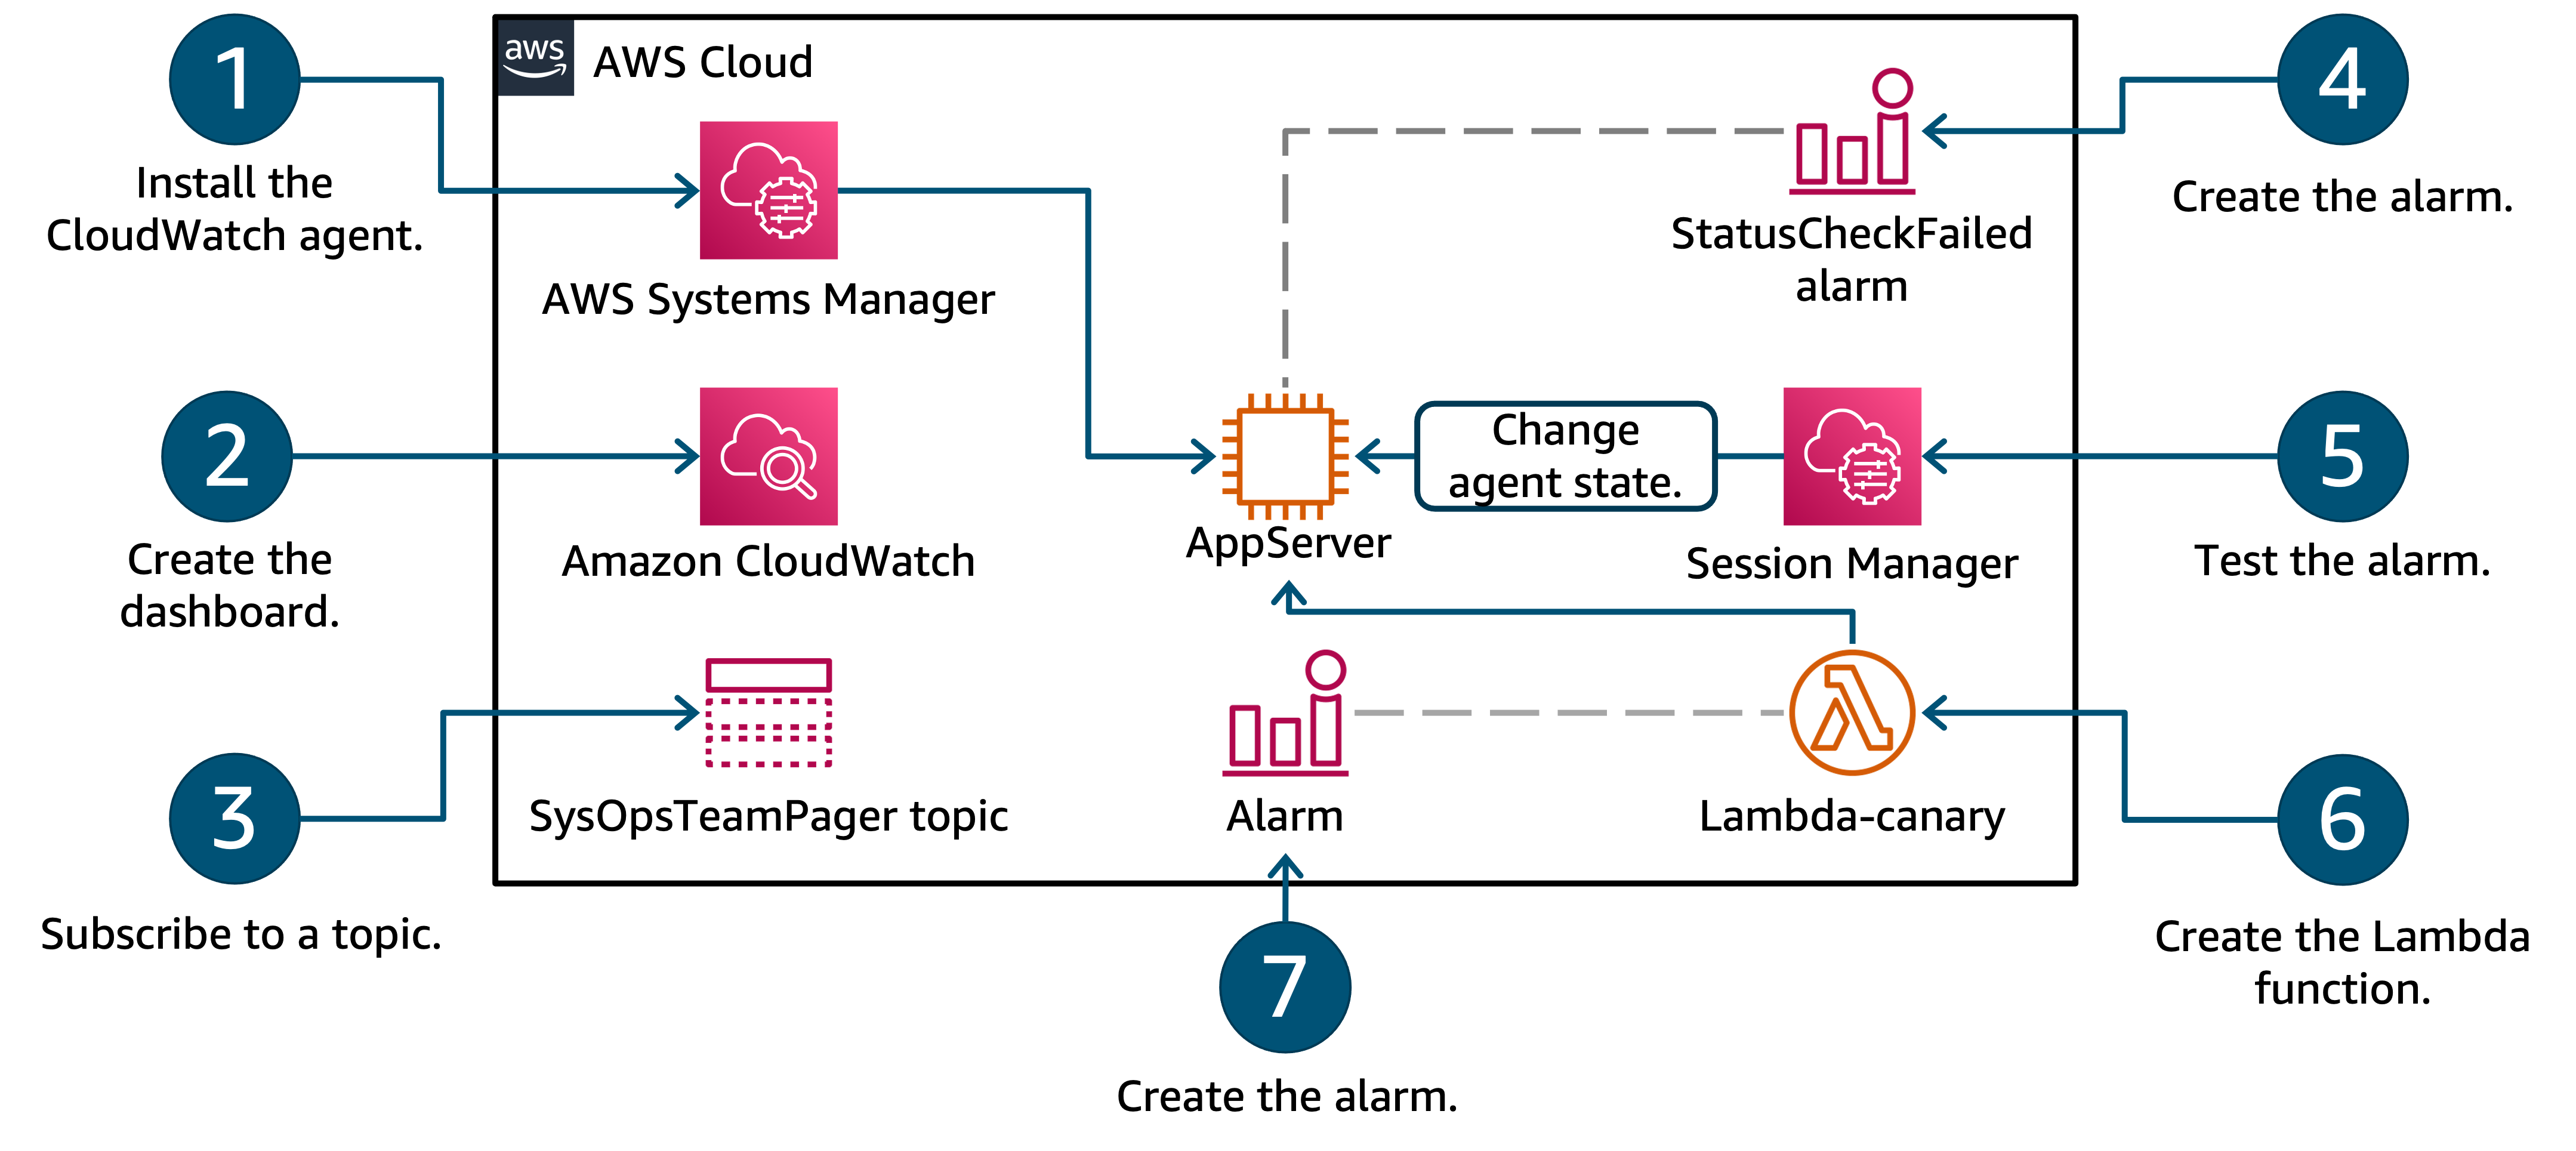
Image description: The preceding diagram depicts the use of AWS Systems Manager to make operational changes to an Amazon EC2 instance. You use the Amazon CloudWatch service to create customized dashboards for specified metrics. You also use the Amazon CloudWatch service to initiate alarms when specified metrics pass defined thresholds. You pair CloudWatch alarms with a topic from Amazon SNS to push notifications out to your subscribed email. You verify the alarming and notification mechanisms you built in the lab are working by using the Amazon CLI. Finally, you create and test an AWS Lambda function which has its own functional CloudWatch alarm.
AWS services not used in this lab
AWS service capabilities used in this lab are limited to what the lab requires. Expect errors when accessing other services or performing actions beyond those provided in this lab guide.
Task 1: Install the CloudWatch agent on the Amazon EC2 instance for monitoring
In this task, you use AWS Systems Manager to install the CloudWatch agent to an Amazon EC2 instance.
You can use the CloudWatch agent to collect both system metrics and log files from Amazon EC2 instances and on-premises servers. The agent supports both Windows Server and Linux Operating Systems and permits you to select the metrics to be collected, including sub-resource metrics such as per-CPU core. Amazon Web Services (AWS) recommends that you use the CloudWatch agent to collect metrics and logs instead of using the monitoring scripts. For more information, you can read ‘Collect Metrics from Amazon EC2 Instances and On-Premises Servers with the CloudWatch Agent’ in the Amazon CloudWatch documentation
The general pre-requisites for installing the CloudWatch agent on an instance using the Systems Manager service are as follows:
- Appropriate AWS Identity and Access Management (IAM) credentials for the CloudWatch and Systems Manager service actions. More details on these roles can be found in the AWS documentation.
- A Systems Manager agent installed on the Amazon EC2 instance or on-premise server to be monitored.
- Routing and network access to the internet or AWS service endpoints, as the service agents make use of ports 443 and 80 for communication with the instance.
Note: For this lab, all the pre-requisite requirements needed to use Sessions Manager and CloudWatch agent with the Amazon EC2 instance are met.
Task 1.1: Update the Systems Manager agent installed on the Amazon EC2 instance
Update the Systems Manager agent on the Amazon EC2 instance by using a Systems Manager command document. Unless you require a specific version of software, updating the installed software and its dependencies to the latest production versions is a best practice.
Note: This lab is built to use Systems Manager and the CloudWatch console for viewing metrics.
Depending on how your infrastructure was deployed in your AWS account, you may need to install the Systems Manager agent prior to installing the CloudWatch agent. The Systems Manager agent is available for both Linux and Windows Operating Systems.
Learn more: For further reading about the Linux installation of the Systems Manager agent refer to appendix.
The Systems Manager agent comes pre-installed on the Amazon Linux 2 Operating System, so you do not need to install it, only to update it.
-
At the top of the AWS Management Console, in the search bar, search for and choose
Systems Manager. -
Locate the Systems Manager navigation menu on the left of the console. If necessary, expand the service navigation menu by choosing the menu.
-
In the left navigation pane, under Change Management Tools, choose Documents.
-
On the Documents page, choose the Owned by Amazon tab.
-
Locate the command document named
AWS-UpdateSSMAgent. -
Choose the link for the AWS-UpdateSSMAgent command document.
The Description page for the command document is displayed.
Note: To review the contents of this, or any Systems Manager command document, choose the link for the name of the command document and choose the Content tab on the subsequent details page.
-
Choose Run command.
The Run a command page is displayed.
-
In the Target selection section, select Choose instances manually.
-
Select the Amazon EC2 instance named AppServer.
-
In the Output options section, clear the checkbox next to Enable an S3 Bucket.
-
Choose Run.
The Run Command summary page is displayed.
-
Refresh the page periodically until the Status column in the Command status section displays Success.
-
Choose the link for the Instance ID in the Targets and outputs section.
-
Expand the Output sections of all the Steps.
-
Review the command outputs and discover which version of the Systems Manager agent was installed on the Amazon EC2 instance.
Hint: Step 1 of this command document determines the operating system deployed, and step 2 will have output related to the agent update.
Task complete: You have used a Systems Manager command document to update the Systems Manager agent installed on the Amazon EC2 instance and verified which version is installed.
Task 1.2: Use AWS Systems Manager to install the CloudWatch agent to a managed Amazon EC2 instance
Use a Systems Manager command document to install the CloudWatch agent onto a managed Amazon EC2 instance.
-
In the left navigation pane, under Change Management Tools, choose Documents.
-
On the Documents page, choose the Owned by Amazon tab.
-
Locate the command document named
AWS-ConfigureAWSPackage. -
Choose the link for the AWS-ConfigureAWSPackage command document.
The Description page for the command document is displayed.
-
Choose Run command.
The Run a command page is displayed.
-
In the Command parameters section, enter
AmazonCloudWatchAgentfor Name. -
In the Target selection section, select Choose instances manually.
-
Select the Amazon EC2 instance named AppServer.
-
In the Output options section, clear the checkbox next to Enable an S3 Bucket.
-
Choose Run.
The Run Command summary page is displayed.
-
Refresh the page periodically until the Status column in the Command status section displays Success.
Task complete: You have used a Systems Manager command document to install the AWS CloudWatch agent to a specific Amazon EC2 instance.
Task 2: Configure and start the CloudWatch agent installed on an Amazon EC2 instance
Utilize Systems Manager command documents to configure and start a CloudWatch agent installed on an Amazon EC2 instance.
With the CloudWatch agent installed to the instance it is now time to configure and start it. Because the lab architecture is using only an Amazon EC2 instance and no proxy servers are involved, the default settings found in the file located on the Amazon EC2 instance at
Note: You must create a CloudWatch agent configuration file before starting the CloudWatch agent on any server .
The CloudWatch agent configuration file is a JSON file that specifies the metrics and logs that the agent is to collect, including any custom metrics. A wizard included with the CloudWatch Agent creates an initial configuration file which you can manually edit or you can create the configuration file yourself from scratch.
Command: That wizard can be started on Amazon Linux 2 OS with the following command:
sudo /opt/aws/amazon-cloudwatch-agent/bin/amazon-cloudwatch-agent-config-wizardIf you create or modify the configuration file manually the process is more complex, but you have more control over the metrics collected and can specify additional metrics not available through the wizard.
Any time you change the CloudWatch agent configuration file the CloudWatch agent service must be restarted before the changes take effect.
After you have created a CloudWatch agent configuration file you can save it locally as a JSON file and use it when installing the agent on your other servers. Alternatively, you can store the configuration file in Systems Manager Parameter Store for later use with command documents. This is the approach you use in this lab.
For this lab, the configuration file is already provided to you and saved in the Parameter Store.
Task 2.1: View the CloudWatch agent configuration file
Review the config file that has been provided for the lab and stored in Parameter Store.
You can store the configuration file locally and reference it when starting the CloudWatch agent service. However, when you store the configuration files in Parameter Store and use it in conjunction with Systems Manager command documents, you can conveniently deploy the same configuration of the CloudWatch agent on many different servers. The process can be used for automation. When you store the configuration file on Parameter Store, it provides an audit trail, supports AWS tagging, and the configuration document can be versioned.
-
In the left navigation pane, under Application Tools, choose Parameter Store.
-
Choose the link for the parameter named AgentConfigFile.
-
Review the raw JSON that makes up the configuration file under the Value section of the document.
Task complete: You have located your CloudWatch agent configuration file in Parameter Store.
Task 2.2 : Start the CloudWatch agent
Start the CloudWatch agent on an Amazon EC2 instance where it has been installed and configured, and verify that the CloudWatch agent is running.
-
If necessary, expand the service navigation menu by choosing the menu.
-
In the left navigation pane, under Change Management Tools, choose Documents.
-
On the Documents page, choose the Owned by Amazon tab.
-
Locate the command document named
AmazonCloudWatch-ManageAgent. -
Choose the AmazonCloudWatch-ManageAgent link.
The Description page for the command document is displayed.
-
Choose the Content tab and examine the document.
-
Notice that the document contains instructions for more than one type of Operating System.
When this command document is ran, you should expect a step error when the OS specified does not match the OS of Amazon EC2 instance. Why is this expected? Do you think the command document will succeed overall or not? Why?
-
Choose Run command.
The Run a command page is displayed.
For the Command parameters section, configure the following parameters:
- Ensure configure is selected from the Action drop-down menu.
- Ensure ssm is selected from the Optional Configuration Source drop-down menu.
- Enter AgentConfigFilein the Optional Configuration Location box. This is the name of the document located in Parameter Store.
- Ensure yes is selected from the Optional Restart drop-down menu.
For the Target selection section, configure the following targets:
- Select Choose instances manually.
- Select the Amazon EC2 instance named AppServer. This is the Amazon EC2 instance where you installed and configured the AWS CloudWatch agent.
- In the Output options section, clear the checkbox next to Enable an S3 Bucket.
-
Choose Run.
The Run command summary page is displayed.
-
Refresh the page periodically until the Status column displays Success for the Amazon EC2 instance.
-
Choose the link for the Instance ID in the Targets and outputs section.
The Output page is displayed.
-
Expand and examine Step 1 - Output and Step 2 - Output and Step 3 - Output sections.
-
Locate the Output section that is relevant to the OS found on the instance.
The first line in the log shows what command was used on the instance. Can you verify that the config file was successfully fetched from Parameter Store?
Knowledge check: Were any errors present? If so what were they and do they make sense?
The last line in the log will show the service is requested to restart after being configured.
Task complete: You have used a command document to configure and start the CloudWatch agent on an Amazon EC2 instance.
Task 2.3: Use SSM documents to verify the CloudWatch agent status on an Amazon EC2 instance
Run the command document name AmazonCloudWatch-ManageAgent to query the status of the agent on an Amazon EC2 instance.
Command: The status of an agent running on a Linux server could be verified by running the following command:
sudo /opt/aws/amazon-cloudwatch-agent/bin/amazon-cloudwatch-agent-ctl \
-m ec2 \
-a status
Command: Or on a server running Windows Server, enter the following in PowerShell as an administrator:
& $Env:ProgramFiles\Amazon\AmazonCloudWatchAgent\amazon-cloudwatch-agent-ctl.ps1 -m ec2 -a statusThis command line process is too manual for managing a large fleet. For this reason, you use the command document to query the status of a service installed on an Amazon EC2 instance.
Any command document process can be applied to any number of instances or on-premises servers which are in your fleet managed by AWS Systems Manager.
-
If necessary, expand the service navigation menu by choosing the menu.
-
In the left navigation pane, under Node Tools, choose Run command.
-
Choose Run command.
-
Enter
AmazonCloudWatch-ManageAgentin the document search bar and press the Enter key. -
Choose the AmazonCloudWatch-ManageAgent link.
The Description page for the command document is displayed.
-
Choose Run command.
The Run a command page is displayed.
For the Command parameters section, configure the following:
- Choose status from the Action drop-down menu.
- Choose default from the Optional Configuration Source drop-down menu.
- Leave Optional Configuration Location blank.
For the Target selection section, configure the following:
- Select Choose instances manually.
- Select the Amazon EC2 instance named AppServer. This is the Amazon EC2 instance where you installed and configured the AWS CloudWatch agent.
- In the Output options section, clear the checkbox next to Enable an S3 Bucket.
-
Choose Run.
The Run command summary page is displayed.
-
Refresh the page periodically until the Status column displays Success for the Amazon EC2 instance.
-
Choose the link for the Instance ID in the Targets and outputs section.
The Output page is displayed.
-
Expand and examine Step 1 - Output and Step 2 - Output and Step 3 - Output sections.
-
Locate the Output section that is relevant to the OS found on the instance.
Expected output: If the agent is running, the output contains lines that are similar to the following:
************************
**** EXAMPLE OUTPUT ****
************************
{
"status": "running",
"starttime": "2023-11-29T21:05:44+0000",
"configstatus": "configured",
"version": "1.300031.0b313"
}
Task complete: You have used a command document to verify the status of an agent running on an Amazon EC2 service.
Task 2.4: Verify CloudWatch agent metrics have been pushed to the CloudWatch service
Verify that the CloudWatch agent metrics are appearing on the CloudWatch dashboard.
-
At the top of the AWS Management Console, in the search bar, search for and choose
CloudWatch. -
In the left navigation pane, under Metrics, choose All metrics.
-
Locate the namespace exactly named CWAgent from the Custom Namespaces section.
Note: If you do not find the CWAgent metric namespace wait for as long as 5 minutes before refreshing the page.
Task complete: If the metric namespace named CWAgent is on the CloudWatch metrics console you have verified that the CloudWatch agent is correctly pushing metrics from the Amazon EC2 instance to the CloudWatch service.
Task 3: Create a CloudWatch dashboard
In this task, you create a customized CloudWatch dashboard consisting of metrics from both the installed CloudWatch agent as well as standard CloudWatch metrics. Dashboards are a great way to setup a tailored view of only the metrics you need for operations, without having to sort through all metrics available.
-
In the left navigation pane, choose Dashboards.
-
Choose Create dashboard.
The Create new dashboard pop-up window is displayed.
-
For the Dashboard name, enter
myDashboard. -
Choose Create dashboard.
The new CloudWatch dashboard is created, and the Add widget pop-up window is displayed.
-
Under the Metrics data type, select Line widget type.
-
Choose Next.
The Add metric graph pop-up window is displayed.
-
Select the metric namespace named CWAgent from the Custom Namespaces.
-
Select the metric namespace that is exactly named ImageId, InstanceId, InstanceType.
-
Select the row where the Metric Name column has a metric named mem_used_percent for the AppServer instance. The AppServer instance ID is listed as AppServerInstanceId in the panel to the left of these instructions.
-
Choose Create widget.
The CloudWatch dashboard myDashboard now displays a singular graph for the percentage of memory used on your Amazon EC2 instance.
-
Choose Save.
Add a second widget to the CloudWatch dashboard myDashboard.
-
Choose + to add a second widget.
The Add widget pop-up window is displayed.
-
Under the Metrics data type, select Stacked area widget type.
-
Choose Next.
The Add metric graph pop-up window is displayed.
-
Select the metric namespace exactly named EC2 in the AWS Namespaces section in the All metrics tab.
-
Select the metric namespace exactly named Per-Instance Metrics.
-
Select the row where the Metric Name column has a metric named NetworkIn for the AppServer instance. Scroll down to find AppServer if necessary.
-
Select the row where the Metric Name column has a metric named NetworkOut for the AppServer instance.
-
Choose the edit icon next to the graph title.
-
Enter
AppServer network activity. -
Choose Apply.
-
Choose Create widget.
The CloudWatch dashboard myDashboard now displays an additional graph for the amount of network activity on your Amazon EC2 instance.
-
Choose Save.
Learn more: Refer to the appendix for a detailed list of all CloudWatch metrics available for Amazon EC2 instances.
Task complete: You created a CloudWatch dashboard consisting of only a few specific metrics and graphs.
Task 4: Subscribe to an AWS Simple Notification Service topic
In this task, you subscribe your email address to a provided Amazon Simple Notification Service (Amazon SNS) topic named SysOpsTeamPager. The Amazon SNS topic is used to alert all subscribed engineers when a specified CloudWatch alarm is triggered.
-
At the top of the AWS Management Console, in the search bar, search for and choose
Simple Notification Service. -
In the left navigation pane, choose Topics.
-
Choose the link for SysOpsTeamPager topic.
-
Choose Create subscription.
-
Select Email from the Protocol drop-down menu.
-
Enter a valid email address you can access in the Endpoint field.
Note: In your personal AWS environment this might be an alias for all of the CloudOps engineers or it might be an individual subscriber. Individual subscribers receive an email and have to confirm the subscription prior to receiving future notifications from the topic.
-
Choose Create subscription.
A banner message with text similar to, “ Subscription to SysOpsTeamPager created successfully.” is displayed at the top of the page.
-
Open the inbox of the email address you entered for the subscription.
-
Locate a recent message from
AWS Notifications <no-reply@sns.amazonaws.com>.Note: It may take up to 5 minutes to receive the email, depending on your email server.
-
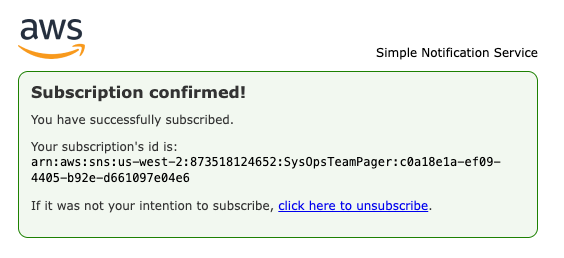
Choose the Confirm subscription link contained in the email.
A page is opened confirming the subscription.
-
Close the Amazon SNS topic subscription confirmation page.
Task complete: You created a new Amazon SNS topic and successfully subscribed to the topic, permitting Amazon SNS to push new messages from this topic to your email address.
Task 5: Create specific CloudWatch alarms for metrics
In this task, you create an alarm to be triggered when a metric passes a defined threshold. CloudWatch alarms can be made for any of the CloudWatch metric. You are not limited to metrics you added to your customized CloudWatch dashboard for monitoring in a previous task.
-
At the top of the AWS Management Console, in the search bar, search for and choose
CloudWatch. -
In the left navigation pane, choose Alarms.
-
Choose Create alarm.
This begins the CloudWatch Alarms guided setup process.
The Specify metric and conditions page is displayed.
-
Choose Select metric.
A Select metric pop-up window is displayed. This is similar to the process for selecting metrics for monitoring purposes on a CloudWatch dashboard, but now you are selecting metrics for alarming purposes.
-
Select the namespace exactly named EC2.
-
Select the namespace exactly named Per-Instance Metrics.
-
Select the row for the AppServer instance where the Metric Name column has a metric named StatusCheckFailed_System. Scroll down to find the relevant AppServer row if necessary.
-
Choose Select metric.
The pop-up window is closed.
The Specify metric and conditions page is displayed.
-
In the Conditions section:
-
For Threshold type, select Static.
-
For Whenever StatusCheckFailed_System is…, select Greater/Equal >= threshold.
-
For than…, enter
1.
-
-
Choose Next.
The Configure actions page is displayed.
-
In the Notification section, ensure Select an existing SNS topic is selected.
-
For Send a notification to…, choose SysOpsTeamPager.
-
Choose Next.
The Add name and description page is displayed.
-
For Alarm name, enter
AppServerSystemsCheckAlarm. -
Copy edit: For Alarm description - optional, enter the following:
This alarm is triggered when an Amazon EC2 instance fails System Reachability check. It is likely that network packets are no longer reaching the instance. Instance and/or network remediation actions are needed to resolve the underlying issue. Refer to the CloudOps run book [insert your runbook URL here] for guidance on resolving this error on Application Amazon EC2 instances. To read more about Amazon EC2 Systems Check refer to AWS documentation https://docs.aws.amazon.com/AWSEC2/latest/UserGuide/monitoring-system-instance-status-check.html#types-of-instance-status-checksIt is best practice for alarm names to be self-descriptive, and for the alarm descriptions to contain useful information. Only 1024 characters are allowed in alarm descriptions. Be succinct, describe the alarm, link to the Operation team’s runbooks, and suggest remediation action.
-
Choose Next.
The Preview and create page is displayed.
-
Choose Create alarm.
Task complete: You have used the CloudWatch console to create an Alarm for a defined metric and threshold. You also configured the alarm to send notifications to an existing SNS topic. More than one alarm can make use of a single Amazon SNS topic.
Task 6: Test the CloudWatch alarm from the AWS CLI
In this task, you use Sessions Manager to log into an Amazon EC2 instance and use the AWS CLI to temporarily change the state for an alarm. It is always useful to test any alarms you build before you actually need them. When building alarms for any metric, instead of building a unique testing workload for each alarm and waiting for the alarm to trigger, it is quicker to test the alarm and any subsequently triggered actions from other services such as Amazon SNS, AWS Lambda, and Amazon EC2 by activating the alarm state from the command line.
Task 6.1: Use Systems Manager and start a session with an Amazon EC2 instance
Use session manager tool found in Systems Manager and start a session with an Amazon EC2 instance.
-
At the top of the AWS Management Console, in the search bar, search for and choose
Systems Manager. -
In the left navigation pane, under Node Tools, choose Session Manager.
-
Choose Start session.
-
Select AppServer Amazon EC2 instance in the Target instances section.
-
Choose Start session.
The session is started in a new tab of your browser.
Task complete: You have started a session with an individual Amazon EC2 instance and have access to the terminal.
Task 6.2: Change the state of a CloudWatch alarm
Command: The following example uses the set-alarm-state command to temporarily change the state of an Amazon CloudWatch alarm named “myAlarm” and set it to the ALARM state for testing purposes. The '–region ’ option must be included if an AWS region is not configured for the local profile. Use the region that your lab was launched in. Your lab’s region is located to the left of these instructions.
aws cloudwatch set-alarm-state \
--alarm-name "myAlarm" \
--state-value ALARM \
--state-reason "testing purposes" \
--region us-east-1
Warning: The Alarm name must match exactly with the CloudWatch alarm name you have setup or the notification mechanism will not work for you.
-
Command: Enter the following command in the terminal of the AppServer instance:
TOKEN=`curl -X PUT "http://169.254.169.254/latest/api/token" -H "X-aws-ec2-metadata-token-ttl-seconds: 21600"`
aws cloudwatch set-alarm-state \
--alarm-name "AppServerSystemsCheckAlarm" \
--state-value ALARM \
--state-reason "testing purposes" \
--region $(curl -H "X-aws-ec2-metadata-token: $TOKEN" -v http://169.254.169.254/latest/meta-data/placement/region)
Expected output:
######################
### EXAMPLE OUTPUT ###
######################

...
< HTTP/1.1 200 OK
< X-Aws-Ec2-Metadata-Token-Ttl-Seconds: 21600
< Content-Type: text/plain
< Accept-Ranges: none
< Last-Modified: Tue, 24 Mar 2026 19:50:55 GMT
< Content-Length: 9
< Date: Tue, 24 Mar 2026 20:16:15 GMT
< Server: EC2ws
< Connection: close
<
{ [9 bytes data]
100     9  100     9    0     0   4838      0 --:--:-- --:--:-- --:--:--  9000
* Closing connection
Note: If you receive the error ‘An error occurred (ResourceNotFound) when calling the SetAlarmState operation: Unknown’ when executing the command, then double-check the command you used for accuracy. It’s likely that either: the incorrect region was specified or a typo occurred in the command.
This command returns to the prompt in the terminal if successful, or one of the command values contains a typo such as the alarm name.
In the inbox of the email account you subscribed to the Amazon SNS topic named SysOpsTeamPager. A new email from the Amazon SNS topic should arrive.
Task complete: You have used the AWS CLI to trigger the alarm state for a specific alarm metric.
Task 6.3: Review the Alarm email and CloudWatch dashboard
Review the email generated by Amazon SNS and the related CloudWatch alarm dashboard.
-
Locate and review the CloudWatch alarm email from
AWS Notifications <no-reply@sns.amazonaws.com>.The email is similar to the example below and contains a link to the appropriate CloudWatch dashboard. Notice that the reason you stated for the alarm in the command, is present in the first few lines of the message body. The rest of the body message details the alarm.
File contents: For current data on the alarm, you need to review the alarm and metric data from CloudWatch console.
You are receiving this email because your Amazon CloudWatch Alarm "AppServerSystemsCheckAlarm" in the US East (N. Virginia) region has entered the ALARM state, because "testing purposes" at "Thursday 18 June, 2020 19:24:09 UTC". View this alarm in the AWS Management Console: https://us-east-1.console.aws.amazon.com/cloudwatch/home?region=us-east-1#s=Alarms&alarm=AppServerSystemsCheckAlarm Alarm Details: - Name: AppServerSystemsCheckAlarm - Description: This alarm is triggered when an Amazon EC2 instance fails System Reachability check. It is likely that network packets are no longer reaching the instance. Instance and/or network remediation actions are needed to resolve the underlying issue. Refer to the Example Company's CloudOps run book [insert your runbook URL here] for guidance on resolving this error on Application Amazon EC2 instances. To read more about Amazon EC2 Systems Check refer to AWS documentation https://docs.aws.amazon.com/AWSEC2/latest/UserGuide/monitoring-system-instance-status-check.html#types-of-instance-status-checks - State Change: OK -> ALARM - Reason for State Change: testing purposes - Timestamp: Thursday 18 June, 2020 19:24:09 UTC - AWS Account: 123456789 - Alarm Arn: arn:aws:cloudwatch:us-east-1:123456789:alarm:AppServerSystemsCheckAlarm Threshold: - The alarm is in the ALARM state when the metric is GreaterThanOrEqualToThreshold 1.0 for 60 seconds. Monitored Metric: - MetricNamespace: AWS/EC2 - MetricName: StatusCheckFailed_System - Dimensions: [InstanceId = i-0c7263cc9e278de8f] - Period: 60 seconds - Statistic: Average - Unit: not specified - TreatMissingData: missing State Change Actions: - OK: - ALARM: [arn:aws:sns:us-east-1:123456789:myOperationalAlarm] - INSUFFICIENT_DATA: -
Select the URL link in the email that follows the statement “View this alarm in the AWS Management Console”.
Your default web browser opens the CloudWatch console on the alarm that was triggered.
Task complete: You have reviewed the alarm notification sent by Amazon SNS and located the appropriate alarm metric within CloudWatch.
Task 6.4: Return to the Amazon EC2 instance and change the state to OK
Because the alarm was triggered by a test, rather than the metric staying above the threshold defined in the alarm, the alarm state for AppServerSystemsCheckAlarm returns to the state OK by itself. However, it is useful to know that the same command can be used to change the state to OK, as well as the state ALARM.
-
Open the Session Manager connection to the AppServer. If the session has timed out, restart the session by closing the browser window and following the same steps from a previous task named Connect to the instance using AWS Session Manager.
-
Command: Enter the following command at the command terminal of the AppServer Amazon EC2 instance:
aws cloudwatch set-alarm-state \
--alarm-name "AppServerSystemsCheckAlarm" \
--state-value OK \
--state-reason "testing purposes" \
--region $(curl -s http://169.254.169.254/latest/meta-data/placement/region)
Note: You do not receive any email from the SNS topic for this action because you are putting the alarm into the OK state. Only those alarms that in the ALARM state trigger a notification.
The session is no longer needed for this lab and you may close it.
Task complete: You have triggered a specific CloudWatch alarm, reviewed the alarm dashboard, and then turned the alarm off.
Challenge Task 7: Configure an AWS Lambda Canary function to use Amazon EventBridge (CloudWatch Events) for a successful website response and test it
In this task, you build and test an AWS Lambda function called Canary from the Lambda blueprints. You also configure a CloudWatch alarm for the Lambda Canary function. The Lambda Canary function queries a website for a response and is configured with a pre-defined expected result. The Lambda function triggers a notification when it receives a result differing from the expected value. Finally, you test the CloudWatch alarm and notification by triggering the alarm intentionally.
Task 7.1: Create the AWS Lambda Canary function
Use the Lambda console to create the AWS Lambda Canary function.
Amazon EventBridge (CloudWatch Events) emits an event every minute, based on the schedule expression. The event triggers the Lambda function, which verifies that the expected string appears in the specified page. For more information on expressions schedules, read schedule expressions using rate or cron.
-
At the top of the AWS Management Console, in the search bar, search for and choose
Lambda. -
Choose Create function.
-
Choose Use a blueprint.
-
In the Blueprints section, choose the search box under Blueprint name.
-
Enter
canaryin the search bar. -
Choose Schedule a periodic check of any URL.
In the Basic information section:
- For Function name, enter lambda-canary.
- For Execution Role, choose Use another role.
- In the Choose an existing role dropdown, choose Lambda-CanaryRole.
In the EventBridge (CloudWatch Events) trigger section:
- For Rule, Select the Create a new rule option.
- For Rule name, enter CheckWebsiteScheduledEvent.
- For Rule description, enter CheckWebsiteScheduledEvent trigger.
- For Schedule expression, enter rate(1 minute)
In the Environment variables section:
- Where the Key is site, for the Value, enter https://docs.aws.amazon.com/lambda/latest/dg/welcome.html
- Where the Key is expected, for the Value, enter What is AWS Lambda?
- For Function name, enter
-
Choose Create function.
The Lambda function has been created and the browser is redirected to the function detail page.
A banner message is displayed with the text, “Congratulations! Your Lambda function “lambda-canary” has been successfully created and configured with CheckWebsiteScheduledEvent as a trigger. Choose Test to input a test event and test your function”
If a Getting started pop-up appears, you can safely choose Dismiss.
Task complete: You have created the Lambda Canary function.
Task 7.2: Test the Lambda function
Test the Lambda function with a sample event provided by the Lambda console.
-
On the lambda-canary page, select the Test tab in the middle of the page next to the Code tab.
-
For Event name, Enter
CanaryTestEvent. -
Keep the default selection of cloudwatch-scheduled-event in the Template - optional drop-down menu.
-
Choose Save.
-
Choose Test.
The output from the test is shown in a banner.
-
Choose Details from the Execution result banner to reveal the logs from the test event.
Task complete: You have created a test for the Lambda function.
Task 7.3: Configure a CloudWatch alarm for the Lambda Canary function
Configure an alarm in Amazon CloudWatch that monitors the Canary Lambda function and sends a notification to an Amazon SNS topic when the defined threshold is passed.
-
At the top of the AWS Management Console, in the search bar, search for and choose
CloudWatch. -
In the left navigation pane, choose Alarms.
-
Choose Create alarm.
This begins the CloudWatch Alarms guided setup process.
The Specify metric and conditions page is displayed.
-
Choose Select metric.
-
Create an alarm with the following settings:
-
In the Metrics section, choose Lambda.
-
Choose By Function Name.
-
Select the row where the FunctionName column has a value lambda-canary and the Metric Name column has the value of Errors.
Note: It can take up to 5 minutes time from creating a Lambda function, until the metrics for that first appear in CloudWatch. If you do not find the lambda-canary metrics, wait for as long as 5 minutes before refreshing the page.
-
-
Choose Select metric.
The pop-up window closes.
The Specify metric and conditions page is displayed.
-
In the Metric section:
-
In the Statistic field, clear the existing value by choosing Sum.
-
In the Period dropdown, clear the existing value by choosing 1 minute.
-
-
In the Conditions section:
-
For Whenever Errors is…, select Greater/Equal >= threshold.
-
For than…, enter
1.
-
-
Choose Next.
The Configure actions page is displayed.
-
In the Notification section, ensure Select an existing SNS topic is selected.
-
For Send a notification to…, choose SysOpsTeamPager.
-
Choose Next.
The Add name and description page is displayed.
-
For Alarm name, enter
lambda-canary-alarm. -
For Alarm description - optional, enter
Lambda Canary did not receive the expected response from the website.. -
Choose Next.
The Preview and create page is displayed.
-
Choose Create alarm.
Task complete: You have created a new alarm based on metrics collected from the Lambda canary function.
7.4: Test the alarm
Test the alarm that has been built for the Lambda function. Rather than manually trigger a specific alarm using the AWS CLI, you intentionally cause errors with a misconfigured update to the Lambda function. This action intentionally breaks the Lambda function and puts the related CloudWatch alarm you previously created into an alarm state.
-
At the top of the AWS Management Console, in the search bar, search for and choose
Lambda. -
In the left navigation pane, choose Functions.
-
Choose the link for the lambda-canary function.
-
Choose the Configuration tab.
-
Select Environment variables from the column of choices.
-
Choose Edit.
The Edit environment variables page is displayed.
-
Locate the Key named expected and change the Value to
404. -
Choose Save.
-
Choose the Test tab.
-
For the Event name, ensure that the CanaryTestEvent is selected.
-
Choose Test.
The misconfigured Lambda function generates an error, and the CloudWatch alarm set for the error metric of the Lambda Canary function triggers. The CloudWatch alarm notifies the Amazon SNS topic SysOpsTeamPager. This is the topic you subscribed your email address to in a previous task named Subscribe to the Amazon SNS topic.
-
File contents: Locate and review the CloudWatch alarm email from AWS Notifications no-reply@sns.amazonaws.com its contents are similar to the following example:
You are receiving this email because your Amazon CloudWatch Alarm "lambda-canary-alarm" in the US West (Oregon) region has entered the ALARM state, because "Threshold Crossed: 1 out of the last 1 datapoints [1.0 (19/06/20 18:22:00)] was greater than or equal to the threshold (1.0) (minimum 1 datapoint for OK -> ALARM transition)." at "Friday 19 June, 2020 18:27:44 UTC".

View this alarm in the AWS Management Console:
https://us-west-2.console.aws.amazon.com/cloudwatch/home?region=us-west-2#s=Alarms&alarm=lambda-canary-alarm

Alarm Details:
- Name:                       lambda-canary-alarm
- Description:                lambda-canary-alarm
- State Change:               OK -> ALARM
- Reason for State Change:    Threshold Crossed: 1 out of the last 1 datapoints [1.0 (19/06/20 18:22:00)] was greater than or equal to the threshold (1.0) (minimum 1 datapoint for OK -> ALARM transition).
- Timestamp:                  Friday 19 June, 2020 18:27:44 UTC
- AWS Account:                123456789
- Alarm Arn:                  arn:aws:cloudwatch:us-west-2:298518306606:alarm:lambda-canary-alarm

Threshold:
- The alarm is in the ALARM state when the metric is GreaterThanOrEqualToThreshold 1.0 for 300 seconds.

Monitored Metric:
- MetricNamespace:                     AWS/Lambda
- MetricName:                          Errors
- Dimensions:                          [FunctionName = lambda-canary]
- Period:                              300 seconds
- Statistic:                           Sum
- Unit:                                not specified
- TreatMissingData:                    missing


State Change Actions:
- OK:
- ALARM: [arn:aws:sns:us-west-2:123456789:SysOpsTeamPager]
- INSUFFICIENT_DATA:
Task complete: You used the Lambda Canary function to simulate the difference between the expected and returned values for a website. This triggered the related CloudWatch alarm and notification services that you setup.
Conclusion
You have successfully done the following:
- Configured telemetry on Amazon Elastic Compute Cloud (Amazon EC2) instances using the Amazon CloudWatch agent, AWS Sessions Manager, command documents, and Parameter Store.
- Created a CloudWatch dashboard to display CloudWatch agent metrics.
- Subscribed to Amazon Simple Notification Service (Amazon SNS) topics for automatic notifications.
- Configured CloudWatch alarms for monitoring and notification when specific metric thresholds are crossed.
- Manually tested any CloudWatch alarm in your AWS environment using the AWS Command Line Interface (AWS CLI).
- Created an AWS Lambda based Canary alarm for a web server.
End lab
Follow these steps to close the console and end your lab.
-
Return to the AWS Management Console.
-
At the upper-right corner of the page, choose AWSLabsUser, and then choose Sign out.
-
Choose End Lab and then confirm that you want to end your lab.
For more information about AWS Training and Certification, see https://aws.amazon.com/training/.
Your feedback is welcome and appreciated.
If you would like to share any feedback, suggestions, or corrections, please provide the details in our AWS Training and Certification Contact Form.